8
$\begingroup$

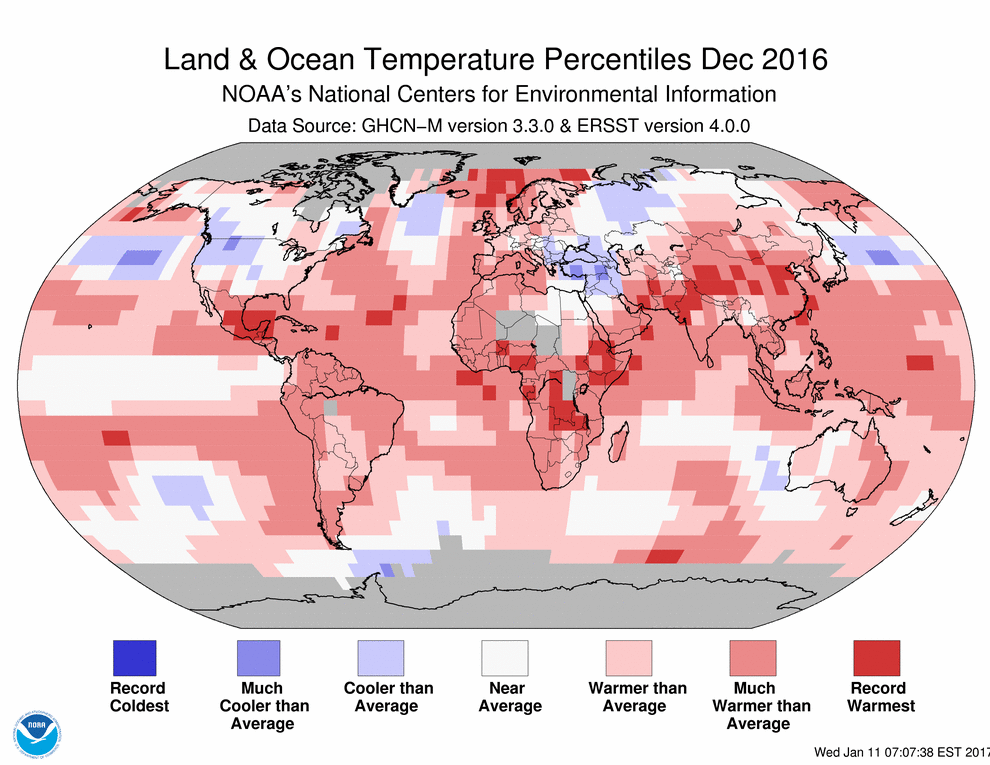
The maps shown below are fromhere. The first shows data from two sources, while the second only shows data from one source.

What is the difference between the two data sources used? Where does it come from, and what is the accuracy?

What is the reason the first map has data the second one doesn't? The most reasonable conclusion is that it comes from the ERSST data that's not in the second map, but it would be nice to know why there is a difference.

ERSST + GHCNM data, Dec 2016

GHCNM data, Dec 2016


A question was posted on theSkeptics siteregarding the claims made in the linked blog post. However, the existing answer currently does not provide much detail and comments were posted suggesting that this site may be able to provide more information about the NOAA data and the science behind it.

$\endgroup$

    1 Answer1

    Reset to default
    5
    $\begingroup$

    The maps shown below are from here.

    Actually, except for the deplorable comments (your "here" was a self-titled deplorable blog site), the maps are fromNOAA itself. The maps without deplorable annotations:

    Map showing land and ocean temperature percentiles for December 2016, from NOAA's National Centers for Environmental Information, data source: GHCN-M 3.0.0 and ERSST version 4.0.0. Coverage is nearly complete from 60° south to 66° north latitude.

    Map showing land-only temperature departures for December 2016, from NOAA's National Centers for Environmental Information, data source: GHCN-M 3.0.0. Coverage is rather spotty except for the continental USA, western Europe, and eastern Asia.


    What is the difference between the two data sources used?

    The most obvious difference is that as the name implies, the ERSST includes data from over the oceans. These data are gathered by buoys, ships, and satellites. A not so obvious difference is that NOAA's merged land–ocean surface temperature analysis incorporates GHCN-M land-based stations that are not used in the GHCN-M land-only map. The locations and ages of the 7280 Global Historical Climatology Network (GHCN) stations are depicted below. Note that the vast majority of the stations in Africa are less than twenty years old.Map showing the location and age of the 7280 Global Historical Climatology Network (GHCN) stations. Most of the stations in Africa are less than 20 years old.

    The land-only analysis uses GHCN-M stations only. It does not use satellite data. Because of this it excludes stations that don't have a solid history of measurements from 1981. This would include the GHCN-M station at theKigali International Airport in Rwanda, whose data coverage over the last 40+ years is only 48%. The GHCN-M-based land-only map only uses about 2600 of the 7280 GHCN-M stations.

    The NOAA Merged Land Ocean Global Surface Temperature Analysis uses satellite data as a sanity check. This enables it to use most of the ~4700 GHCN-M stations excluded from the land-only map.

    $\endgroup$
    10
    • 1
      $\begingroup$ Another important difference: the first map is not "departure from 30-year average" but apercentile map. As the linked page explains, the selection criterion for a station in the percentile map is at least 80 years of data, but itdoesn'trequire a continuous 1981-2010 record, which allows them to use stations excluded from the "departure from average" map. I assume that in many cases the >=80 recorded years are not contiguous. $\endgroup$
      Feb 7, 2017 at 15:47
    • $\begingroup$ @David Hammen, you say are using "satellite data as a sanity check". Are you saying that it is using satellite data to add to the record length such that the percentiles are more meaningful, or are you saying that it uses the satellite data to independently verify the recorded data period (or current observations), but does not extend the record length to make the percentiles more statistically comparable? $\endgroup$ Feb 7, 2017 at 18:37
    • $\begingroup$ @Pont, strange, if that's the criteria, it's fairly tough to envision that all of those oceanic squares have data for 80 total years, regardless of continuity. There seems there would would have to have been permanent instrumentation in obscure ocean areas in the 1930s or earlier. And of course satellites aren't old enough to help. $\endgroup$ Feb 7, 2017 at 18:42
    • $\begingroup$ @JeopardyTempest - All readings need a sanity check. In the last month, the high temperature at the airport nearest to me was supposedly 140 F. While I live in Houston, it doesn't get that hot in the middle of summer, let alone in the middle of winter. It was just a glitch. Those glitches need to be filtered out. The best approach is to compare to other reliable nearby measurements and toss extreme outliers on the floor. But what if there aren't any, as is the case in remote areas? (continued) $\endgroup$ Feb 7, 2017 at 18:42
    • $\begingroup$ The GHCN-M-only data rejects a large number of stations because of lack of history, isolatedness, incompleteness, or sketchiness. There are ways to deal with these issues, and the merged land-ocean global surface temperature analysis attempts to do just that. $\endgroup$ Feb 7, 2017 at 18:44

    Your Answer

    By clicking “Post Your Answer”, you agree to ourterms of service,privacy policyandcookie policy

    Not the answer you're looking for? Browse other questions taggedorask your own question.